
Your POS system watches every transaction in your business — every admission, every pizza, every refund a manager approves at 9 PM. A POS report is how all of that watching becomes something you can act on. This guide covers the seven report types every operator should know, the X-vs-Z basics, what good reports actually look like, and the venue-specific metrics that retail-focused guides never mention.
What Is a POS Report? (Quick Answer)
A POS report is a data summary generated by your point-of-sale system that turns raw transactions into operational insight: sales totals, product performance, inventory movement, staff metrics, discounts and refunds, and payment reconciliation. Retailers use them to close the day and manage stock — and in entertainment venues, they’re also where sessions, parties and F&B meet in one number.
The difference between operators who grow and operators who guess usually isn’t the data — every modern POS produces roughly the same reports. It’s whether anyone reads them with a decision in mind. That’s how this guide is organized: each report type below comes with the question it answers and the decision it enables.
The 7 POS Report Types Every Operator Should Know
1. Sales Summary Report
What it shows: gross and net sales, taxes, tips, discounts, transaction count and average order value for any date range.
The decision it enables: is the business on plan — today, this week, versus last year? This is the report you read every single morning, and the baseline every other report explains.
2. Product Mix Report
What it shows: what actually sells — top items, slow movers, category performance, item-level margins.
The decision it enables: what to promote, reprice or kill. A short menu that sells beats a long menu that sits; if you run venue F&B, this is where the high-margin concession winners reveal themselves — and where the item nobody ordered in six weeks gets its retirement notice.
3. Inventory Report
What it shows: stock counts, low-stock alerts, shrinkage, cost of goods sold.
The decision it enables: what to order and where margin is leaking. The gap between what you sold and what left the shelf is one of the most expensive numbers in the building.
4. Employee Performance Report
What it shows: sales per staff member, transactions handled, upsells, hours worked.
The decision it enables: who to schedule on your busiest shifts, who needs training, and whether your upsell scripts actually run at the counter. Use it to coach, not to punish — the numbers usually reveal process problems before people problems.
5. Discounts, Voids & Refunds Report
What it shows: every price override, comp, void and refund — who did it, when, and why.
The decision it enables: where money quietly disappears. A spike in voids on one shift is a training conversation; a pattern of overrides by one login is a different conversation. This is the report most operators skip and most fraud examiners read first.
6. Payment & Reconciliation Report
What it shows: takings by payment method — cash, cards, vouchers, gift cards — against what’s actually in the drawer and on the processor statement.
The decision it enables: closing the day with confidence. Unexplained drawer differences are either mistakes or messages; this report tells you which, before they compound.
7. Time & Peak Hours Report
What it shows: sales and transactions by hour and day — your demand heatmap.
The decision it enables: staffing that matches reality. If Saturday 2–5 PM does a third of your weekly revenue, your rota, your kitchen prep and your session pricing should all know it.
X Report vs. Z Report: The End-of-Day Classics
Two terms survive from the cash-register era, and every POS still uses the concepts:
| X Report | Z Report | |
|---|---|---|
| When | Any time during the day | At close of business |
| What it does | Snapshot of totals so far — no reset | Final totals for the day — resets counters to zero |
| Used for | Mid-shift checks, drawer spot-counts | The official daily close, reconciliation, the number that goes to accounting |
The practical rule: X to check, Z to close. Run one Z per day at the same time, and your daily numbers stay comparable — the enemy of clean reporting is a close that happens “whenever we remember.”
What Does a POS Report Look Like? (Real Examples)
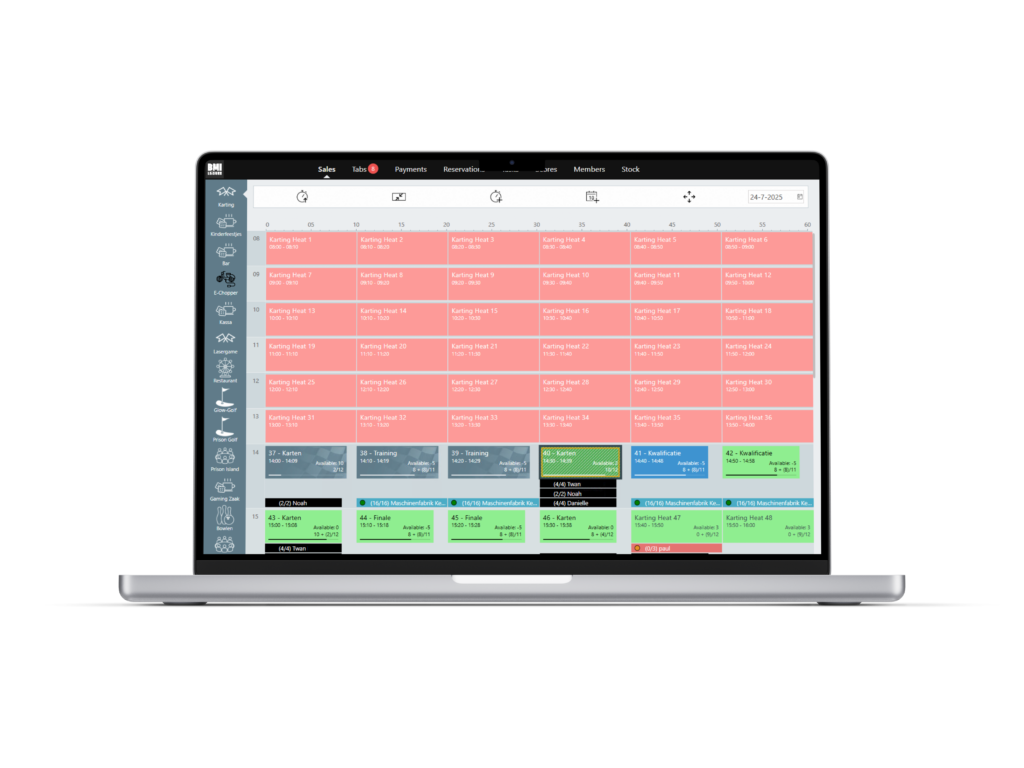
A well-designed POS report follows the same visual grammar wherever you meet it: a date range at the top, KPI tiles for the headline numbers (gross sales, net sales, transactions, average order value), then breakdowns — by product, category, employee, payment method or hour. End-of-day versions add the cash reconciliation block. Modern platforms render the same reports on desktop, tablet or phone, and let you schedule them by email so Monday’s summary is waiting before you are.
POS Report Best Practices: The Daily, Weekly, Monthly Rhythm
Reports don’t improve a business; the rhythm of reading them does. The cadence that works:
- Daily (5 minutes): yesterday’s sales summary vs. same day last week, the reconciliation report, and a glance at voids/refunds. Five numbers, coffee in hand.
- Weekly (30 minutes): product mix — what moved, what didn’t; peak-hours heatmap against the rota you actually scheduled; employee performance trends.
- Monthly (1 hour): month vs. month and vs. last year, inventory and COGS review, discount policy check, and one decision made on the evidence — a price change, a menu cut, a staffing shift.
- Always: same Z-close time daily, promo codes on everything trackable, and one person who owns the numbers — reports nobody owns are reports nobody reads.
POS Reports for Entertainment Venues: The Metrics Retail Never Sees
Everything above applies to any business with a till. But a trampoline park, karting track or family entertainment center isn’t a shop — it sells time slots, parties and experiences, and standard retail reports can’t see any of that. When your POS and your booking system share one guest record, a second layer of reporting appears:
The 5 venue metrics your POS report should answer
- Session utilization — what percentage of available jump/race/play capacity actually sold, by daypart. The venue equivalent of occupancy, and the number that should drive your pricing.
- Revenue per guest (per capita) — admission plus F&B plus retail plus arcade, per head. The metric that turns “busy” into “profitable.”
- Party P&L — package revenue plus add-ons and F&B per party, against staff and room time. Parties are most venues’ margin engine; they deserve their own line, not a lump in “sales.”
- F&B attach rate — what share of admissions also bought food. If it’s low, the fix is usually layout, bundles or speed, and the report tells you which.
- Repeat and membership revenue — how much of this month came from returning guests. Growth that compounds shows up here first.
Why venue reporting needs POS + bookings in one system
None of those five metrics exist if the POS rings up food while a separate tool books sessions — the data lives in two silos that don’t share a guest. That’s the reporting argument for an all-in-one platform: with POS, bookings, parties and F&B feeding one reporting module, every purchase ties to a guest and a session, and the venue metrics above become standard views instead of spreadsheet projects.
See Every Number That Runs Your Venue — In One Place
BMI Leisure’s reporting connects POS, bookings, parties and F&B into one view: session utilization, per-guest revenue, party P&L and daily closes, across every location.
Contact usFrequently Asked Questions
What is a POS report?
A data summary generated by your point-of-sale system that turns every transaction into operational insight: sales totals, product mix, inventory movement, staff performance, discounts and refunds, and payment reconciliation. Operators use them to close the day accurately, spot trends, schedule staff around peaks, and decide what to promote or drop.
What is a POS Z report?
The classic end-of-day closing report: it totals all sales, taxes, payments and discounts since the last close, then resets the counters to zero for the next business day. Its sibling, the X report, shows the same totals mid-day without resetting. The names come from cash-register tape terminology and modern POS systems still use the concepts.
What does POS stand for?
POS stands for point of sale — the place and system where a customer pays, whether a counter terminal, self-serve kiosk or online checkout. Seeing “POS” on a bank statement means a card-present purchase at such a terminal — we break that down in our guide to the POS purchase meaning.
What does a POS report look like?
Usually a dashboard or table with a date range, KPI tiles (gross sales, net sales, transactions, average order value), and breakdowns by product, category, employee, payment type or hour. End-of-day versions add cash-drawer reconciliation. Modern systems show the same reports on any device and can schedule them by email.
Sources
- Oracle — Simphony Essentials: POS Reports documentation (example of an enterprise POS report catalog: financial, check, menu item, audit, table service and clock-in reports). docs.oracle.com — verified July 28, 2026.
- BMI Leisure — Salting case study (five centers standardized on one platform; 70% online bookings growth). First-party case study.
Report names and exact contents vary by POS platform — X/Z terminology descends from cash-register conventions and is described here in its common industry usage. Venue metrics require a system where POS and booking data share one guest record. Last updated: July 28, 2026.