
Ask how big the family entertainment center market is and you’ll get a confident number. Ask three research firms and you’ll get three confident numbers, with growth forecasts that differ by a factor of two. Almost every article on the topic picks one figure and repeats it as fact.
This one does the opposite. It puts every estimate that research firms publish openly side by side, shows how each firm defines the market, and explains why the “location-based entertainment” market somehow comes out roughly five times smaller than the FEC market (using the midpoints of the published ranges). Then it adds a layer the market reports don’t have: primary numbers from SEC filings and franchise disclosure documents, where companies report what actually happened rather than what a model projects. We build venue software for FECs, so we read these numbers for a living; we have no stake in which estimate is right.
How Big Is the Family Entertainment Center Market?
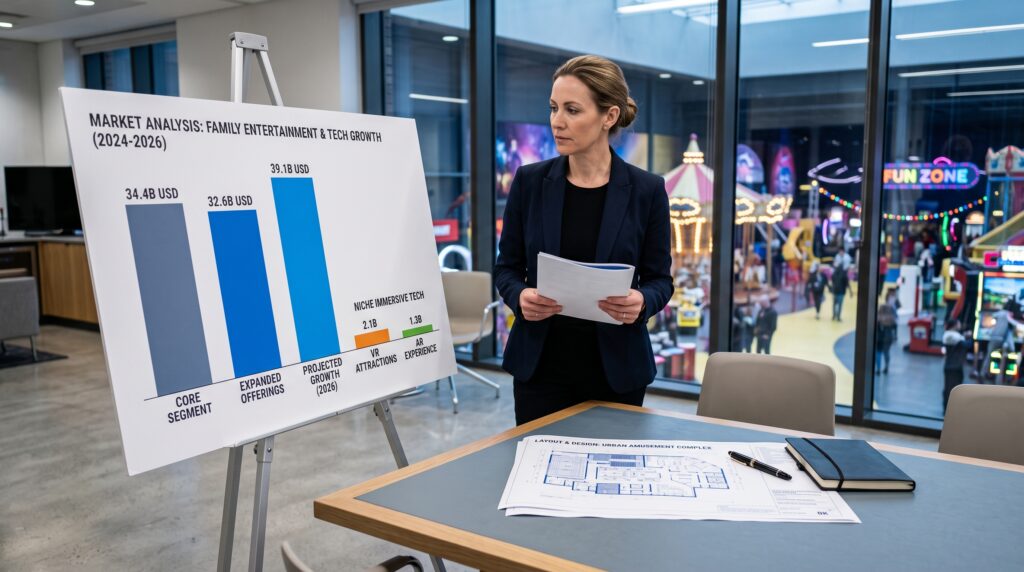
Between US$32.6 and US$34.4 billion globally in 2025, according to the research firms that publish a figure openly: $32.62 billion (Mordor Intelligence, rising to $34.57 billion in 2026) and $34.4 billion (Future Market Insights). North America holds about a third of the market (34.47% in 2025, per Mordor). Growth forecasts range from 6.75% to 14% a year, depending on the firm and its definition.
Key Statistics at a Glance
- $32.62B–$34.4B: global FEC market size in 2025 (Mordor Intelligence; Future Market Insights). Mordor projects $34.57B for 2026.
- 6.75% to 14%: range of annual growth forecasts across Mordor (to 2031), Future Market Insights (to 2035) and Technavio (to 2030).
- ~34–35%: North America’s share of the market (Mordor, 2025) or of forecast growth (Technavio).
- 36.4%: arcades’ share of the FEC market, the largest segment (Future Market Insights).
- 41.2%: tickets’ share of FEC revenue streams (Future Market Insights).
- $5.5B–$7.5B (2024–2025 base years): the “location-based entertainment” market, measured as immersive technology rather than venues (MarketsandMarkets, Fortune Business Insights, Precedence Research).
- 62.9% / 37.1%: entertainment vs. food and beverage share of revenue at Dave & Buster’s, which runs 243 venues across two brands (10-K, fiscal 2025).
- 8.1% vs. 24.8%: cost of entertainment vs. cost of food, each as a share of its own revenue, at Dave & Buster’s.
- −5.0%: Dave & Buster’s comparable store sales in fiscal 2025, even as the category grows.
- $2.045M: average unit volume published by one trampoline franchisor (Altitude, 2026 FDD).
The Estimate Spread: Every Published FEC Market Figure, Side by Side
These are the figures each firm states on its own public report page, checked on September 23, 2026. The full reports cost thousands of dollars; what’s below is what they publish for free, which is also what everyone else ends up quoting.
| Research Firm | Market Size | Forecast & Growth | Market Definition & Scope |
|---|---|---|---|
| Future Market Insights | $34.4B Base year: 2025 |
$93.5B by 2035
10.5% CAGR
|
Arcades lead at 36.4% share; tickets the top revenue stream at 41.2%. |
| Mordor Intelligence | $32.62B (2025) $34.57B in 2026 |
$47.93B by 2031
6.75% CAGR
|
Children’s, edutainment, adult and VR centers; physical play, arcades, AR/VR zones, skill games (bowling, laser tag, go-karts, mini golf). |
| Technavio | — Not stated as total |
+$38.32B (2026–2030)
14% CAGR
|
Arcade studios, physical play, competition games, AR/VR gaming zones; North America 34.9% of growth. |
Two things stand out. First, the size estimates roughly agree: for the same year, 2025, the two firms land at $32.62 billion (Mordor) and $34.4 billion (Future Market Insights), a gap of about 5%. Second, the growth forecasts don’t: 6.75% a year compounds to about $48 billion by 2031, while 10.5% reaches $93.5 billion by 2035. The disagreement is almost entirely about the future, which is where modeling choices matter most. If you’re citing a growth rate, cite the firm and its forecast window with it.
Why the “Location-Based Entertainment” Market Is Smaller Than the FEC Market
This is the most common mistake in articles about the sector. “Location-based entertainment” sounds like the bigger, umbrella category, and searches for the location based entertainment market often assume it includes every FEC and indoor entertainment center. In the research reports, it’s the smaller one:
| Research Firm | LBE Market Size | Forecast | CAGR |
|---|---|---|---|
| MarketsandMarkets | $5.47B Base year: 2024 | $15.33B by 2029 | 22.9% |
| Fortune Business Insights | $6.18B Base year: 2025 | $31.71B by 2034 | 19.9% |
| Precedence Research | $7.52B Base year: 2025 | ~$87.50B by 2035 | 27.81% |
The reason is scope. MarketsandMarkets defines LBE as “immersive, technology-driven experiences hosted in physical locations such as theme parks, arcades, family entertainment centers, and museums,” and the key players it names are Microsoft, Google, Meta, NVIDIA and Unity. Fortune Business Insights segments the market by technology (projection mapping, AR/VR) and component (hardware, software). In other words, most LBE reports measure the technology installed in venues, not the venues’ revenue. That’s also why LBE growth rates (20–28% a year) run far ahead of FEC rates: a young technology layer grows faster than the venues it’s installed in.
The practical rule: use FEC figures when you’re talking about the venue business, and LBE figures only when you mean VR, AR and immersive installations. Precedence Research sizes the US LBE market at $2.03 billion in 2025, a useful number for that narrower question.
What the Market Is Made Of
The reports slice the market in consistent ways, even when their totals differ. Mordor’s segmentation is the most detailed publicly:
- By venue type: children’s entertainment centers, children’s edutainment centers, adult entertainment centers and location-based VR centers. (The indoor entertainment center market is essentially the same universe under a different label; most reports treat “family/indoor entertainment centers” as one category.)
- By activity: physical play (trampolines, soft play, indoor playgrounds), arcade studios, AR/VR gaming zones, and skill and competition games (bowling, laser tag, go-karts, mini golf).
- By revenue source: entry fees and ticket sales, food and beverage, merchandising and redemption, advertising and sponsorship.
- By facility size: from under 5,000 sq ft to parks over 10 acres.
On the segment level, Future Market Insights estimates arcades as the largest category at 36.4% of the market and tickets as the largest revenue stream at 41.2%. The arcade figure is worth remembering: the game floor is not a side business in this industry, which is why cashless card systems and arcade management software have become core infrastructure rather than add-ons.
The Primary Numbers: What Operators Actually Report
Market reports model the category from the outside. Two kinds of documents show it from the inside, because the law requires companies to state them accurately: SEC filings from public operators and franchise disclosure documents (FDDs) from franchisors.
Dave & Buster’s: the revenue mix of a 243-venue operator
Dave & Buster’s Entertainment runs both the Dave & Buster’s and Main Event brands. Its 10-K for the fiscal year ended February 3, 2026 is the most detailed public view of how a large FEC business actually earns:
| Metric (Fiscal 2025) | Figure |
|---|---|
| Total revenues | $2,102.8 million −1.4% YoY |
| Entertainment revenues | $1,323.5 million, 62.9% of total |
| Food and beverage revenues | $779.3 million, 37.1% of total |
| Cost of entertainment | 8.1% of entertainment revenues |
| Cost of food and beverage | 24.8% of food and beverage revenues |
| Operating payroll and benefits | 25.5% of total revenues |
| Comparable store sales | −5.0% |
| Average store size | Dave & Buster’s 37,000 sq ft; Main Event 53,000 sq ft; new Dave & Buster’s stores opened in fiscal 2025 averaged about 28,000 sq ft |
Three lessons sit in that table. Play is the profit engine: every dollar of entertainment revenue cost about 8 cents in direct costs, against about 25 cents for every dollar of food.
Labor is the biggest controllable line, at a quarter of revenue. Separately, the company notes that guests buy game credits at automated kiosks and through its mobile app as well as from team members, a self-service mix that plausibly helps manage that labor line. And formats are shrinking: new stores are coming in about a quarter smaller than the chain average, which the company says allows it to “reduce capital investment risk per store and enter smaller markets that would not have warranted the investment of a larger box.” The −5.0% comparable sales figure is the reminder that category growth and same-store growth are different things.
Franchise disclosures: unit economics you can check
Franchisors publish investment and performance figures on their own pages, drawn from their FDDs. We compiled and verified them in September 2026 for our family entertainment center franchise guide; the headline numbers:
| Brand | Published Figure | Type |
|---|---|---|
| Altitude Trampoline Park | $2.045M average unit volume; 24.6% EBITDA; 9.1% average cost of goods (2026 FDD, USA) | Performance claim |
| Galaxy Fun Park | “$3,000,000 Average Annual Gross Revenue” | Performance claim |
| Launch Entertainment | $3,517,213–$6,501,900 initial investment (FDD Item 7) | Investment |
| Starlite Family Fun Centers | $1,421,000–$1,748,500 initial investment, including fee | Investment |
| Sky Zone | 130+ owner groups, $800M+ generated, 320+ markets, 45M+ guests | System scale |
Put the two sources together and a rough picture of a single venue emerges: from about $1.42 million (Starlite, a 22,000–24,000 sq ft center) up to $6.5 million (Launch, a larger-format park) to open, and $2.0–3.0 million in average annual revenue for the two brands that publish one (Altitude and Galaxy). These are different brands and footprints, not one venue’s range. These are franchisor claims, published to sell franchises, so treat them as the upper-middle of the distribution rather than the typical case.
Launching a Venue? The Market Research That Actually Matters
If you’re reading this because you’re planning a venue, here’s the honest ordering: a global market size is the least useful number on this page for your decision. A $34 billion market growing at 7–14% tells you the category is healthy. It says nothing about whether your site, in your town, will fill on a Tuesday. The research that decides that is local:
- Your trade area. Population, household income and number of children within a realistic drive time. Franchisors publish their own thresholds; Launch Entertainment targets roughly 200,000 people, household incomes of $75,000+ and about 20,000 children under 14.
- Your competition. Every venue competing for the same family’s Saturday, not just the same attraction type: trampoline parks, bowling, cinemas and the mall.
- Your concept against your site. Square footage, ceiling height, parking and rent decide which attractions fit, and Dave & Buster’s smaller new-store footprint shows a 243-venue operator rethinking size. It’s one company’s data, but worth weighing for your own concept.
- Your unit economics. Build the model from primary sources: FDD Item 7 tables for investment, published franchisor averages for revenue, and public filings like the 10-K above for cost structure.
For concept options, our profitable entertainment business ideas guide compares the main formats. When you get to operations, the numbers above point to where the margin lives: the game floor, the food counter and the labor line, which is exactly where software earns its keep. Our guide to running a family entertainment center and our FEC software comparison cover the platforms that run them.
Planning or Growing a Venue?
The margin in this industry lives on the game floor, at the food counter and in the labor line. BMI Leisure runs booking, POS, cashless and kiosks for more than 300 venues worldwide. Tell us about your concept and we’ll show you how the numbers work in practice.
Talk to Our TeamFrequently Asked Questions
How big is the family entertainment center market?
Between about US$32.6 and US$34.4 billion globally in 2025, according to the research firms that publish a figure openly: Mordor Intelligence puts it at US$32.62 billion (rising to US$34.57 billion in 2026) and Future Market Insights at US$34.4 billion. North America accounts for roughly a third of the market (34.47% in 2025, per Mordor). Treat these as estimates rather than counts — each firm defines a family entertainment center differently, and the full reports sit behind paywalls.
How fast is the family entertainment center industry growing?
Forecasts range from about 6.75% to 14% a year, depending on who you ask: Mordor Intelligence projects a 6.75% CAGR to 2031, Future Market Insights 10.5% to 2035, and Technavio 14% to 2030. Operator filings are more sobering: Dave & Buster’s, which operates 243 venues across its two brands, reported comparable store sales down 5.0% in its fiscal 2025. Growth in the category is real, but it comes from new venues and new formats as much as from existing venues selling more.
What is the difference between the family entertainment center market and the location-based entertainment market?
Scope. Family entertainment center reports measure the venues themselves — admissions, food, arcades and parties — and land around US$32–35 billion. Most location-based entertainment reports measure the immersive technology installed in venues, such as VR, AR and projection mapping, and land between US$5.5 and US$7.5 billion, with Microsoft, Google and Meta among the key players named. That is why the ‘LBE market’ looks smaller than the FEC market even though the name sounds broader.
How do family entertainment centers make money?
Mostly from play, then food. At Dave & Buster’s, entertainment (games and attractions) was 62.9% of fiscal 2025 revenue and food and beverage 37.1%, and the margins differ sharply: the cost of entertainment was 8.1% of entertainment revenue versus 24.8% for food and beverage. Future Market Insights estimates tickets as the leading revenue stream across the category at 41.2%. Parties, memberships and redemption prizes fill in the rest.
What market research do I need before opening an entertainment venue?
Local research matters far more than global market size. Start with your trade area: population, household income and the number of children within a realistic drive — Launch Entertainment, for example, publishes targets of roughly 200,000 people, household incomes of $75,000+ and about 20,000 children under 14. Then map competing venues, test the concept against your site’s size and rent, and build a unit-economics model from primary sources such as franchise disclosure documents rather than global forecasts. Global reports tell you the category is growing; only local data tells you whether your venue will.
Sources
- Future Market Insights — Family Entertainment Center (FEC) Market (US$34.4 billion in 2025; US$93.5 billion by 2035; 10.5% CAGR; arcades 36.4% share; tickets 41.2% of revenue streams; report dated August 26, 2025). futuremarketinsights.com — verified September 23, 2026.
- Mordor Intelligence — Family Entertainment Center Market (US$32.62 billion in 2025; US$34.57 billion in 2026; US$47.93 billion by 2031; 6.75% CAGR; North America 34.47% in 2025; segmentation by type, activity, demographics, revenue source and facility size; page updated September 11, 2026). mordorintelligence.com — verified September 23, 2026.
- Technavio — Family Entertainment Center Market (market size “valued to increase by USD 38.32 billion, at a CAGR of 14% from 2025 to 2030”; North America 34.9% of growth; published May 2026). technavio.com — verified September 23, 2026.
- MarketsandMarkets — Location-Based Entertainment Market, press release via GlobeNewswire, May 30, 2025 (US$5.47 billion in 2024; US$15.33 billion by 2029; 22.9% CAGR; definition and key players). globenewswire.com — verified September 23, 2026.
- Fortune Business Insights — Location Based Entertainment Market (US$6.18 billion in 2025; US$31.71 billion by 2034; 19.90% CAGR; North America 39% in 2025). fortunebusinessinsights.com — verified September 23, 2026.
- Precedence Research — Location-Based Entertainment Market (US$7.52 billion in 2025; ~US$87.50 billion by 2035; 27.81% CAGR; North America 36%; US market US$2.03 billion in 2025). precedenceresearch.com — verified September 23, 2026.
- Dave & Buster’s Entertainment, Inc. — Form 10-K for the fiscal year ended February 3, 2026, filed March 31, 2026 (revenues, revenue mix, cost ratios, payroll, comparable store sales, store sizes and the stated rationale for smaller formats, kiosk and app credit sales). sec.gov — verified September 2026.
- Franchisor figures (Altitude Trampoline Park, Galaxy Fun Park, Launch Entertainment, Starlite Family Fun Centers, Sky Zone) — each company’s own franchise page, verified September 17–18, 2026, as documented with full sources in our family entertainment center franchise guide.
Market size figures are third-party estimates from research firms’ public report pages; the full reports are paywalled and each firm defines the market differently, so figures should be cited with their source and year. Operator figures come from an SEC filing and from franchisors’ own published claims, which are marketing figures and not earnings representations to any reader. Grand View Research and other firms whose pages could not be accessed for verification are not cited. BMI Leisure is the publisher of this compilation and sells venue management software to family entertainment centers; it has no commercial relationship with any research firm or franchisor listed. Last updated: September 23, 2026.